
Tag: kubernetes

  • From Zero to Stable: Frontend Platform’s Load Testing Journey with k6

    From Zero to Stable: Frontend Platform’s Load Testing Journey with k6

    How we went from inconsistent results and infrastructure chaos to a reliable, automated performance regression pipeline for Remix apps.

    Why We Built This

    Frontend Platform owns the template layer that all Remix apps at CarGurus build on.

    When the template ships changes — dependency upgrades, platform improvements, new defaults — those changes ripple across every consumer. A 100ms regression in LCP doesn’t show up in unit tests or linting. It only shows up in production, after it’s already slowed down real users.

    We needed a way to catch performance regressions before they shipped — not just backend latency, but real Core Web Vitals: LCP, INP, CLS, TTFB. And we needed it to run automatically on every relevant change, integrated into CI/CD, with clear pass/fail signals.

    That’s what the k6 load testing pipeline was built to do.

    Choosing the Tool: k6 vs Locust

    Before building anything, we evaluated two options: the in-house Locust self-service load testing tool already offered to all engineering teams, and k6 from Grafana.

    The Locust tool’s strength is organizational familiarity — it’s already in use for backend services. But for our use case, it had a fundamental gap: it couldn’t measure Core Web Vitals. It could tell us server response times, but it couldn’t tell us whether a user’s browser actually rendered the LCP element in time.

    In addition, the self-service load testing tool periodically auto-deletes load test deployments, which conflicts with our need for stable, repeatable configurations and persisted results for longitudinal template/platform benchmarking.

    k6’s browser module changes the equation.

    A single k6 script can run both a backend load test (constant RPS via ramping-arrival-rate, measuring HTTP response times) and a CWV collection phase (headless Chromium, measuring real browser metrics).

    What made this compelling:

    • One script, both dimensions — backend latency and real browser metrics collected in the same test run.
    • Unified reporting — both sets of results feed into the same baseline comparison and produce a single pass/fail signal.
    • TypeScript all the way down — test scripts are written in the same language as the apps being tested.
    • Self-contained regression detection — k6’s handleSummary API lets us intercept all results and run baseline comparison, majority voting, and report generation entirely within the k6 process, without external tooling.

    The Initial Setup

    With the tool selected, we built out a first version of the pipeline. The load-testing-suite repo runs as a service pod on our Kubernetes cluster.

    When a new release tag becomes available in the Remix template, it:

    1. Deploys the target app to an isolated environment (using a truncated CI run identifier as a unique selector, preventing parallel test collisions).
    2. Warms up the app with one single HTTP GET request before k6 starts.
    3. Runs two k6 scenarios concurrently:
      • backend_load — constant RPS for backend metrics.
      • cwv_collection — headless Chromium for browser metrics.
    4. Compares results against the 3 most recent saved baselines using majority voting — if 2 of 3 show a critical regression, the test fails. (Baselines are JSON files committed to the load-testing-suite repo’s baselines/ directory, one per build, written by k6’s handleSummary and persisted via Git.)
    5. Cleans up the deployment.

    The orchestration between the Remix template repo and the load-testing-suite repo uses GitHub’s workflow_call mechanism — the template repo’s test-orchestrator.yml calls load-testing-suite’s run-test.yml as a reusable workflow.

    Flowchart illustrating the deployment process for a Remix app template, detailing feature pull requests, merging to main, provisioning test environments, and load testing workflows.
    Architecture diagram: load-testing-suite components and orchestration.

    The Instability Problem

    Once the pipeline was running end-to-end, we hit a serious problem: the results weren’t reliable. The same commit, tested twice, could produce wildly different numbers.

    Here’s what we saw across two runs against the same commit:

    MetricRun 1Run 2
    Response time P95199ms52ms
    Response time P99598ms132ms
    LCP P75431ms295ms
    TTFB P7552ms36ms

    A 4x difference in P95 means the baseline comparison is noise, not signal. Any regression detection built on these numbers would generate constant false positives.

    Digging into the test output logs, two patterns emerged.

    In the bad runs, TTFB would spike to 200–470ms during the first 30 seconds of the test — the ramp-up phase — and then stay elevated for the rest of the run.

    There were also mid-test throughput dips (iteration rate dropping from 20/s to 6/s) that corresponded with outlier P99 values above 900ms.

    The root causes fell into two categories: the test design was amplifying noise, and the infrastructure was generating it.

    Test Design Fixes

    Warming up the app after deployment

    A freshly deployed Node.js process doesn’t serve requests at full speed because V8 uses tiered compilationthe compilation tier “levels up” based on how many times a function executes.

    Diagram illustrating the V8 Tiering Lifecycle, showing stages: Ignition, Sparkplug, Maglev, and Turbofan along with their corresponding compilation tier up mechanism and execution frequency.
    Diagram: JIT compilation tiers and warm-up behaviour.

    For a Remix app, every layer of a request — route handlers, data loaders, serialization — begins in the slower interpreter tier, while the baseline tier kicks in after ~8 invocations.

    In our early runs, the first request to a fresh deployment took 95–101ms; steady-state responses settled around 25–35ms. That gap is V8 working through its compilation tiers.

    We added a 3-phase warmup between deployment verification and the k6 test:

    1. Readiness: 3 sequential smoke requests to confirm readiness.
    2. Hot path warmup: 3 batches of 10 concurrent requests to push hot functions through enough invocations for TurboFan and warm downstream connection pools.
    3. Steady-state verification: 3 final requests to verify steady state.

    The 36 total requests over ~10–15 seconds aren’t a magic number — they’re enough for V8 to promote the critical request path into optimized tiers before the k6 ramp-up begins.

    Moving from ramping-vus to ramping-arrival-rate

    The original test used k6’s ramping-vus executor.

    With ramping-vus, each VU (virtual user — k6’s unit of concurrency, essentially a single simulated client) loops as fast as it can — request, sleep, repeat. If the app slows down, each VU completes fewer iterations per second, so actual RPS drops. The load is coupled to app performance.

    For regression testing, this is the wrong model. The variable we’re testing is the code change — so everything else needs to stay constant, including the load.

    With ramping-vus, if a code change makes responses 2x slower, the executor responds by delivering 2x less traffic, which can mask the regression. We want to send the same load regardless of how the app is doing, so any difference in P95 is a real signal.

    We switched to ramping-arrival-rate, which fires requests at a fixed rate and allocates however many VUs are needed to maintain it.

    Extending test duration

    The last design fix was the most straightforward: extending the steady-state phase from 2 minutes to 3 minutes, with a 1-minute ramp-up.

    At 30 concurrent VUs, we observed periodic 5–10 second slowdowns occurring roughly every 2 minutes — consistent with V8’s major garbage collection pauses under sustained load.

    With a 2-minute steady-state phase, a GC cycle might land entirely within the measurement window in one run and straddle the boundary in another, creating significant variance in P95 between runs of the same commit.

    We extended the steady-state phase from 2 minutes to 3 minutes to guarantee that every run captures exactly one GC cycle within the measurement window. At a ~2-minute GC interval, a 3-minute steady state ensures the pause always lands inside the window rather than sometimes falling during ramp-up or ramp-down.

    Every run pays the same GC cost, so the variance between runs drops.

    Infrastructure Fixes

    The test design changes made a clear difference. Two runs against the same commit after the fixes:

    MetricBefore (ramping-vus, 2min) Run 1Before Run 2After (arrival-rate, 3min) Run 1After Run 2
    Response time P95199ms52ms81ms49ms
    P95 Variance147ms (4x)32ms (1.7x)

    Backend variance dropped from a 4x swing to under 2x. But LCP P75 still varied significantly between runs — 368–455ms on some runs, ~260ms on others — with no code changes in between.

    The remaining issue was infrastructure-level: the k6 pod was landing on different EC2 instance types each time, and those instance types had meaningfully different CPU characteristics.

    We measured the same test across four different instance placements:

    Instancenr_throttledthrottled_usecThrottle rateLCP P75
    r5a.24xlarge (gen 5)29437.8s7.9%455ms
    m5a.16xlarge (gen 5)1499.2s4.2%368ms
    c6a.2xlarge (gen 6)1508.4s4.6%~260ms
    m6a.32xlarge (gen 6)956.5s2.2%~260ms
    Diagram explaining instance types with labels: 'Instance Family,' 'Instance Generation,' and 'Instance Size' pointing to the components 'm6a.32xlarge.'
    A breakdown of what each of the characters in the instance type name stands for.

    The gen 5 instances (r5a, m5a) use AMD EPYC 7571 CPUs running at 2.5 GHz.

    The gen 6 instances (c6a, r6a, m6a) use the newer EPYC 7R13 at 3.6 GHz boost.

    That’s a ~40% clock speed difference.

    Why instance type matters for LCP:

    The gen 5 and gen 6 rows above have a ~40% CPU clock speed difference (2.5 GHz vs 3.6 GHz).Chromium’s rendering pipeline — parsing HTML, computing layout, executing JavaScript, painting — is largely single-threaded.A faster clock runs the same rendering work proportionally faster, which directly reduces the LCP measurement.

    The 455ms vs ~260ms gap in the table above has nothing to do with the app’s performance; it’s an artifact of where the k6 pod landed.

    CPU limits and CFS throttling

    Linux’s Completely Fair Scheduler (CFS) enforces CPU limits in 100ms windows. If a container exceeds its limit during any window, the kernel pauses all its threads until the next window — even if the node has idle cores.

    Diagram illustrating CPU limitations in container management, showing quota used over a total period and periods of throttling when CPU limits are exceeded.
    Kubernetes diagram: how CFS quota enforces CPU limits on pod containers.

    The pod was originally configured with a 3-core CPU request and 3-core CPU limit, making it a Guaranteed QoS class.

    The problem: Chromium is briefly bursty during page rendering. It might need 4–5 cores for 200ms during layout and paint, even though its average usage over a 100ms CFS period is within limits. The kernel doesn’t care about averages — it pauses the container the moment it exceeds the limit for that period.

    The fix would be to remove the CPU limit while keeping the 3-core request. The pod could then burst above 3 cores when Chromium needs it, eliminating kernel-level throttling during rendering.

    QoS would change from Guaranteed to Burstable, meaning the pod could theoretically be evicted under node memory pressure before Guaranteed pods — acceptable for a short-lived test pod.

    Moving to gen 6 instances

    Removing the CPU limit addressed throttling, but the clock speed variance between gen 5 and gen 6 instances remained.

    We couldn’t pin the k6 pod to a specific instance type — our internal tooling doesn’t expose nodeSelector or affinity fields, and the controller reverts any direct kubectl patch to the Deployment within seconds.

    We consulted the infrastructure team about this constraint and agreed that pinning the k6 pod to a specific instance type was the wrong fix, since it wouldn’t reflect how production pods are actually scheduled. Instead, they raised the minimum instance generation to 6 across our dev clusters, allowing gen 5 nodes to phase out naturally.

    The key insight:

    All gen 6 instance families — c6a, r6a, m6a — use the same AMD EPYC 7R13 CPU at the same clock speed.Once gen 5 instances are gone, a k6 pod landing on any gen 6 node will see the same hardware characteristics for CPU-bound work.The variance from CPU clock speed differences goes away.

    The Stabilized Workflow

    With all changes in place, here’s what the pipeline looks like:

    Test configuration:

    • Executor: ramping-arrival-rate
    • Stages: 1-minute ramp-up → 3-minute steady state.
    • Max VUs: 5 (sufficient headroom at 5 RPS with ~50ms response time).

    Infrastructure:

    • k6 pod: 3-core CPU request, no CPU limit (Burstable QoS).
    • Cluster: gen 6 minimum instance generation (EPYC 7R13, uniform clock speed across all placements).
    • Node.js cluster: 3 explicit workers (CLUSTER_CPUS=3), not auto-detected from host.

    Orchestration:

    • GitHub Actions workflow_call from the template repo to load-testing-suite.
    • Isolated environments via unique CI run identifier as selector.
    • Baseline comparison using majority voting across the 3 most recent saved baselines.
    • Slack notification with P95, error rate, RPS, and all Core Web Vitals.

    Result stability achieved: Runs against the same commit now show P95 differences in the range of ~10ms rather than 100–200ms swings. The LCP variance that was making regression detection impossible has collapsed. The pipeline can now reliably distinguish a real regression from infrastructure noise.
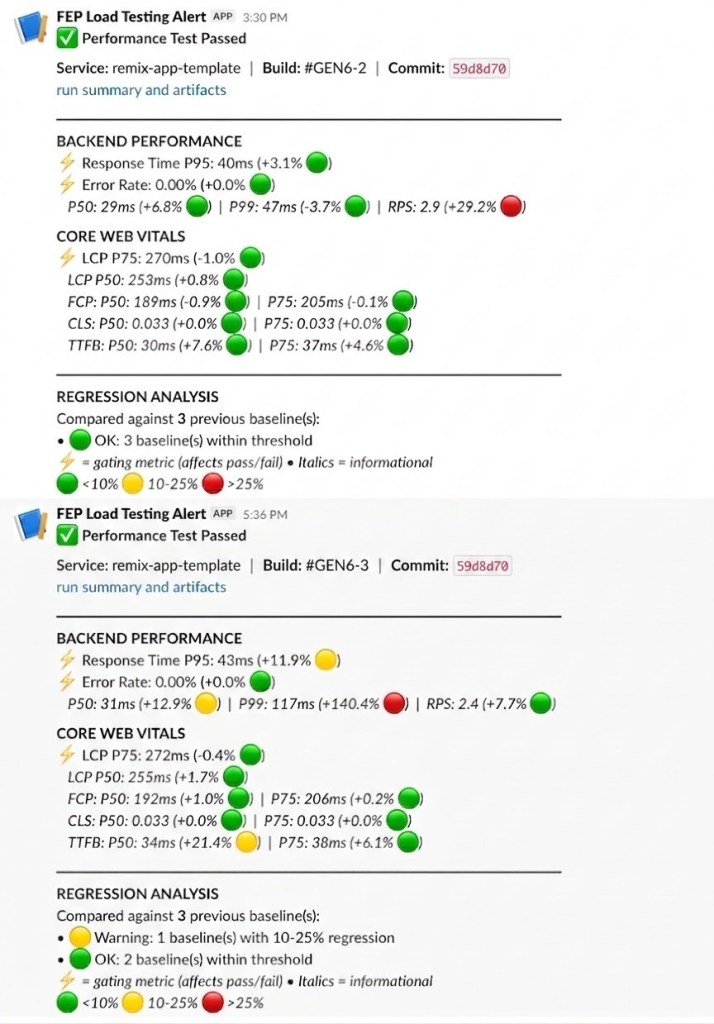
    Performance test report with results from two separate tests, showing backend performance metrics, core web vitals, and regression analysis. Key metrics include response times, error rates, LCP, FCP, and more, indicated with colored indicators for performance status.
    Two consecutive load test runs against the same commit on gen 6 instances show: Response Time P95 differs by just 3ms (40ms vs 43ms) and LCP P75 differs by 2ms (270ms vs 272ms).

    What We Learned

    A few things stood out from this process:

    The biggest source of variance wasn’t the test design — it was hardware. No amount of statistical filtering or outlier trimming would have fixed a 40% CPU clock speed difference.

    Collecting enough data helps, but understanding what’s causing the variance is what lets you fix it.

    Switching from ramping-vus to ramping-arrival-rate was the right call for regression testing. Load that couples to app performance can mask regressions; load that’s independent of app performance surfaces them clearly.

    The constraint from EP — avoid instance pinning so results reflect real production scheduling — was initially frustrating but ultimately correct. The right fix was making the cluster more homogeneous, not making the test more artificial.

    k6’s handleSummary API is genuinely powerful. The entire regression detection pipeline — baseline loading, majority voting, report generation, Slack notification content — runs inside handleSummary as TypeScript, without any external services. That simplicity has made the system easy to extend and debug.
  • How CarGurus is Supercharging Our Microservice Developer Experience

    How CarGurus is Supercharging Our Microservice Developer Experience

    Originally written by Jahvon Dockery, Principal Software Development Engineer.

    As you may expect, maintaining a continuously growing distributed system architecture does come with developer experience challenges. For instance, running the services in development may require additional services or you may need multiple backing data stores with realistic data. Also, building and deploying the microservices across environments may become more challenging as the expected configuration or underlying platform may be different. As Frank Fodera described in the last Revved blog post, Decomposition Journey at CarGurus, over the last couple of years CarGurus has invested significantly into decomposing our monolithic services into many smaller microservices. You must be wondering how we were able to make our development team way more effective given this shift. Let me walk you through how we are supercharging the developer experience at CarGurus!

    There are many tools that seek to solve some of these challenges and in some organizations, a large number of shared shell scripts fill the gaps that the tools don’t fill – that’s exactly what we were doing at CarGurus for a large part of our decomposition journey and we still leverage some of those scripts and tools today. However, that still leaves a lot of undesired complexity for software engineers who may need to use many tools and many scripts during the development process.

    Enter Mach5 – an internal tool which serves to simplify a lot of the complexity involved with developing, configuring, and releasing microservices that are part of CarGurus’ distributed systems.

    Introducing Mach5

    Over the last couple of years, the Engineering Platform team at CarGurus has worked with the CarGurus product engineers to understand their typical development workflows and pains. Given what we learned, we developed Mach5. Named after the Mach Five from the 1960s manga and animated TV series “Speed Racer”, its main goal is to simplify and supercharge the developer experience for our software engineers. Much like the supercharged car from “Speed Racer,” Mach5 has many features designed to help the user overcome challenges – in our case, development process challenges.

    From the developer’s perspective, Mach5 is a command line interface that acts against a “workspace” of configuration files that coexist with the microservice’s source code. Under the hood, the command line interface is running various processes locally, resolves service dependencies on demand, and triggers infrastructure operations based on the service’s Mach5 configuration through a backing Mach5 registry service.

    Understanding Mach5 Environments

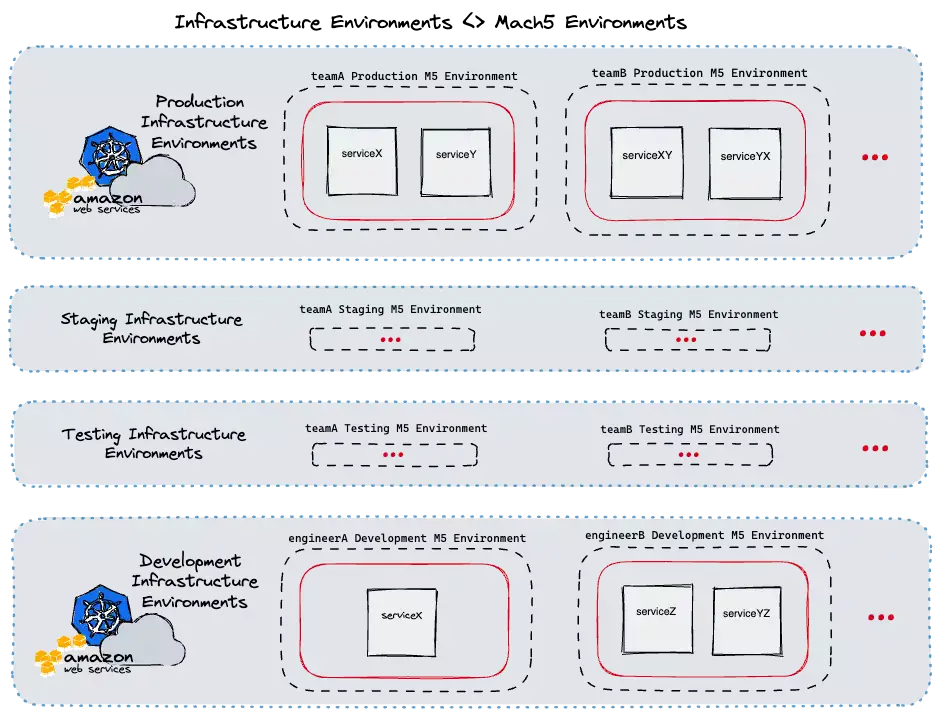
    A key component of Mach5 is the “Environment” concept. In Mach5, microservices are deployed to environments, therefore most Mach5 operations are done within the environment scope. Each Mach5 environment serves a specific purpose. For instance, each of our development teams have their own dedicated testing, staging, and production environments (for service deployments within those stages of the release cycle). In addition, each engineer also has their own dedicated development environments.

    Mach5 is able to map its own internal environments to the CarGurus’ infrastructure environments when acting on users’ requests. Given this, Mach5 can also provide guardrails around infrastructure environments that the typical user should not be modifying themself (e.g. production) . The below diagram illustrates this at a high level.

    Overview of mach5 environments
    Overview of mach5 environments

    We automate the creation of every environment based on an internal registry of development teams and software engineers. By automating this, we can guarantee that every new engineer onboarding into CarGurus and every new team that is created will have their Mach5 environments ready without any additional work on their part.

    Example use case – Mach5 deploy

    By far, the most used Mach5 CLI command by developers is mach5 deploy. This command simplifies many of the largest challenges around developing microservices in a distributed system.

    Overview of mach5 deployments
    Overview of mach5 deployments

    As shown in the above diagram, this single command triggers a multi-step workflow handled by the Mach5 CLI client and the backing registry service. We’ve designed Mach5 and the deploy command in a way that allows for extending and customizing the microservice deployment process without requiring the user to know too many specifics about the underlying platform that these services are running on. Now, let’s dive in deeper to understand some of the key parts of this workflow.

    Artifact build and publish

    At CarGurus, we have a variety of applications – including Java, Node, and Golang applications. We mostly leverage Bazel to build and publish these applications’ images. Often the first thing engineers will need to do if they wish to deploy a service for testing is set the correct Bazel tags or run the correct target. However, if you are working on multiple microservices, having to remember the various command syntaxes can increase an engineer’s cognitive load when context switching.

    This becomes even more challenging to do when teams need their own custom build logic or if they are using Maven instead. Mach5 is agnostic about the build and artifact publishing systems it uses. The underlying logic of those steps can be configured through scripts by our product engineers as part of the deployment’s preconditions. When an engineer runs a mach5 deploy, the client will automatically run those preconditions against the current code that the user has locally. The published artifacts are then used for the next step of the deploy, the workload deployment.

    Following a deployment, Mach5 will also run any configured postconditions for that service. A common use case for postconditions is syncing local assets to an external file system for the deployed service to use. Preconditions and postconditions lowers the barrier to entry for engineers across teams who may want to get a service that they don’t actively work on running without having to follow a series of manual steps for bootstrapping the service.

    Workload deployment

    A core principle we have for Mach5 is that its deployment is meant to be infrastructure-agnostic. Currently, CarGurus use Kubernetes to run most of our application workloads and have clusters for our production, staging, and development environments. Within each of those clusters, we associate namespaces to the various Mach5 “environments” described above. Our main use case currently is for deploying within these Kubernetes clusters but we have plans on extending Mach5 using our internal provider interface to enable users to deploy different types of workloads, such as AWS Lambda functions.

    Kubernetes can be a complex system to work with for many product engineers. There are many tools for deploying a workload to Kubernetes; including using kubectl or Helm directly. However, given the complexity of Kubernetes, it may not be safe to allow every software engineer to have access to applying changes into a Kubernetes cluster directly. With the provider interface I mentioned, Mach5 can be configured to deploy a raw Kubernetes manifest or it can take in a Helm chart and values files for the deployment.

    This gives us a great chance to do some pre-deployment processing and validation and to limit the permissions down to our single Mach5 backing registry. We are also planning on supercharging this process even more by enabling Mach5 to integrate with Kubernetes operators that respond to specific Custom Resource Definitions.

    Service Dependencies and Delegates

    One of the biggest challenges with developing a microservice is understanding service dependencies. At CarGurus our product engineers maintain over 80 microservices and that number continues to grow. In addition, each service may need a backing data store or they may need to leverage external systems like Kafka for messages. This is where Mach5 really drives a more seamless developer experience! Before we get to that, let’s revisit the “environment” concept.

    At a high level, each environment ends up being a collection of deployed services. With what we call “delegation”, that collection of services is conceptually expanded into a larger collection. Here is a simplified YAML representation of how a Mach5 environment is typically composed:

    name: engineerA
    selectors: [development]
    data:
      delegatedEnvironments:
      - name: global
        selectors: [staging]
      - name: teamA
        selectors: [staging, internal]
      deployments:
      - name: serviceA
      - name: serviceA
        selectors: [testingChange1]
      - name: serviceB
        selectors: [testingChange1]
      kubernetesData:
        cluster: dev-cluster-na
        namespace: engineerA-user-namespace
      owner: engineerA

    As part of an individual Mach5 service’s configuration, you can specify the dependencies on other services. The Mach5 registry that backs the CLI operations knows about all environments and all currently existing deployments. If it detects that service X depends on service Y, it will first check the current Mach5 environment for service Y. If it does not exist there, then it will check the delegated environments noted above to find the next closest match. All development Mach5 user environments are delegated to our staging environment.

    We represent the data stores and external systems as services that can be added to specific environments so the same searching will be applied to those dependencies. Thanks to Mach5, once the workload for service X has been deployed, it routes to the identified dependent services without requiring the engineer to separately deploy all of its dependencies.

    Overview of mach5 service resolution
    Overview of mach5 service resolution

    As you’d imagine, this provides some great benefits. If an engineer would like to test changes to two services together, all they have to do is deploy both of those services to their environment. They can even deploy their own instance of the backing data store if they do not want to use the delegated staging data store.

    At any point, they can use a mach5 undeploy command against their services when they are done testing or if they want to fall back to using the delegated service.

    Selectors

    Many software engineers may run into cases where they would like to do testing against one git branch, pass it off for feedback or testing, and continue additional development while they wait. That’s where our selector capability comes in. Selectors allow different variants of a single service to be deployed and linked to other similar variants.

    A user can specify an optional selector with any Mach5 deployment. That will follow the same flow as described above but it will keep any existing deployment without the specified selector untouched. As shown in the diagram above, the selector is also used as part of the service dependency search; so you can deploy multiple versions of a service within your environment (with differing selectors) but Mach5 will prefer the dependent services with a matching selector over deployments without one.

    For Mach5 environments, we use selectors to describe the various purposes of those environments. For instance, teamA will likely have 3 environments as noted above. The name is always teamA but the various selectors would be testingstaging, or production to represent those stages of the release cycle.

    Additional Debugging Tools

    The Mach5 CLI and the backing registry service are continuing to grow based on feedback from our internal product engineers. This has shaped Mach5 into a much more robust tool for all software engineers in the organization. In addition to managing microservice deployments, the CLI can be used to get information like available ingress hosts and logs for existing deployments.

    We are continuously learning, iterating, and improving Mach5 as a means to improve our overall developer experience at CarGurus. If this is something you’re interested in then I recommend checking out our open roles!